

You must complete Become Contributor and Publish Visuals before sales data appears here.
Sales overview
The page lists every visual that has generated sales during the selected period. Each row shows: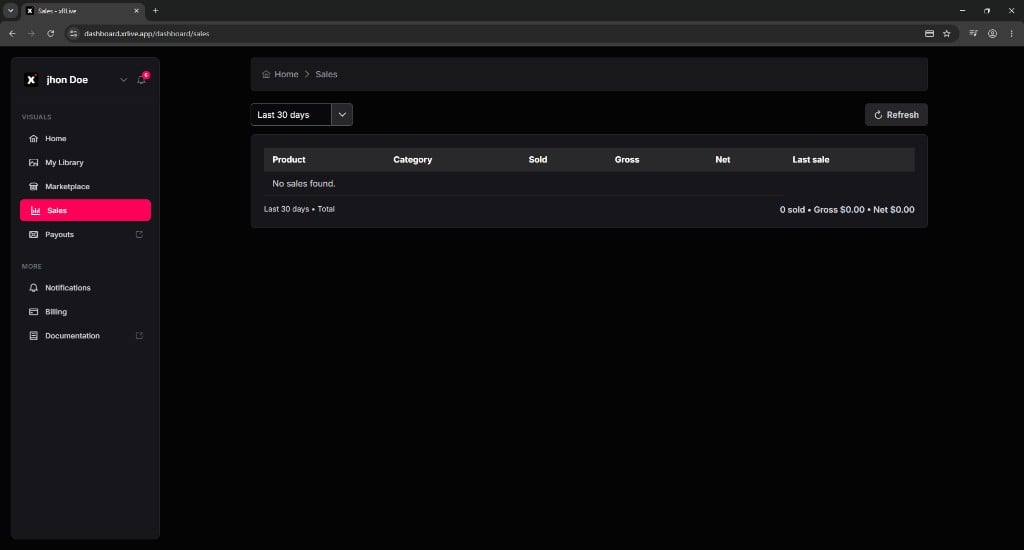
Sales dashboard — filter by period, refresh data, and review per-visual revenue
Filter and refresh
Use the Last 30 days dropdown at the top left to change the reporting period. Click Refresh to pull the latest sales data from the server. The summary bar at the bottom shows totals for the selected period — for example, Last 30 days • Total with the combined sold, Gross, and Net amounts.Where to go next
Payouts
Manage your Stripe Express account and track payouts.
Publish Visuals
Submit more visuals to the Marketplace.