> ## Documentation Index
> Fetch the complete documentation index at: https://xrlive.mintlify.site/llms.txt
> Use this file to discover all available pages before exploring further.
# Sales
> Track revenue and performance for your published visuals
The **Sales** page shows how your published visuals are performing on the Marketplace — units sold, gross revenue, and what you earn after platform fees. Open it from **Sales** in the dashboard sidebar, or go to [dashboard.xrlive.app/dashboard/sales](https://dashboard.xrlive.app/dashboard/sales).
You must complete [Become Contributor](/dashboard/creator/become-contributor) and [Publish Visuals](/dashboard/creator/publish-visuals) before sales data appears here.
## Sales overview
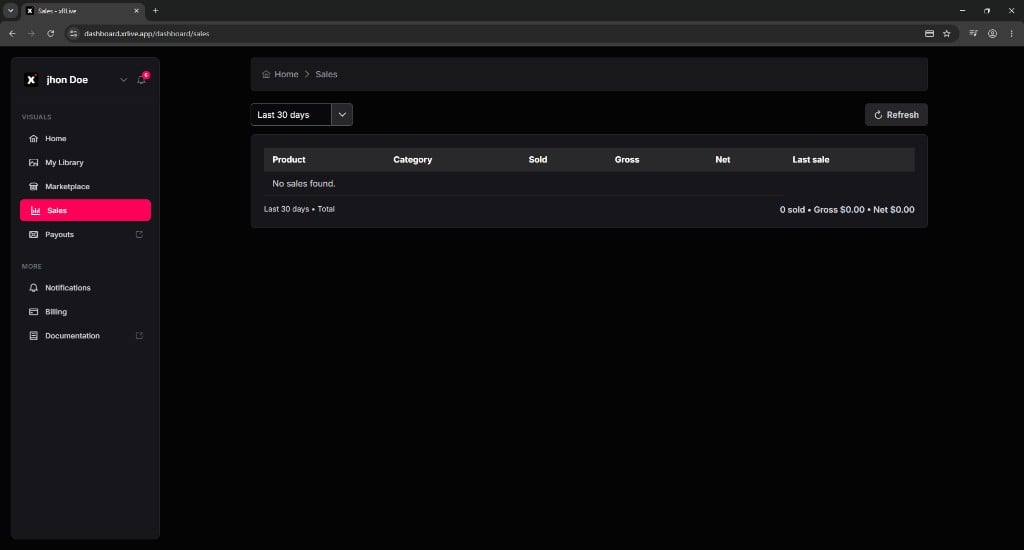
The page lists every visual that has generated sales during the selected period. Each row shows:
| Column | Description |
| ------------- | ------------------------------------ |
| **Product** | The visual name |
| **Category** | Marketplace category |
| **Sold** | Number of units sold |
| **Gross** | Total revenue before fees |
| **Net** | Your earnings after the platform fee |
| **Last sale** | Date of the most recent purchase |
 ## Filter and refresh
Use the **Last 30 days** dropdown at the top left to change the reporting period. Click **Refresh** to pull the latest sales data from the server.
The summary bar at the bottom shows totals for the selected period — for example, *Last 30 days • Total* with the combined **sold**, **Gross**, and **Net** amounts.
If you just published a visual, sales may take a moment to appear. Use **Refresh** after your first purchase to confirm the data is up to date.
## Where to go next
Manage your Stripe Express account and track payouts.
Submit more visuals to the Marketplace.
## Filter and refresh
Use the **Last 30 days** dropdown at the top left to change the reporting period. Click **Refresh** to pull the latest sales data from the server.
The summary bar at the bottom shows totals for the selected period — for example, *Last 30 days • Total* with the combined **sold**, **Gross**, and **Net** amounts.
If you just published a visual, sales may take a moment to appear. Use **Refresh** after your first purchase to confirm the data is up to date.
## Where to go next
Manage your Stripe Express account and track payouts.
Submit more visuals to the Marketplace.